Visualizing Weather Data
Problem:
One of the first projects I worked on for the Washington Wine Commission was designing an interactive map that used weather data from WSU to help Washington wineries and vineyards choose the location and time to grow and purchase their grapes. This map became a great resource for the trade, but was not as useful to the tourists in the wine industry.
Solution:
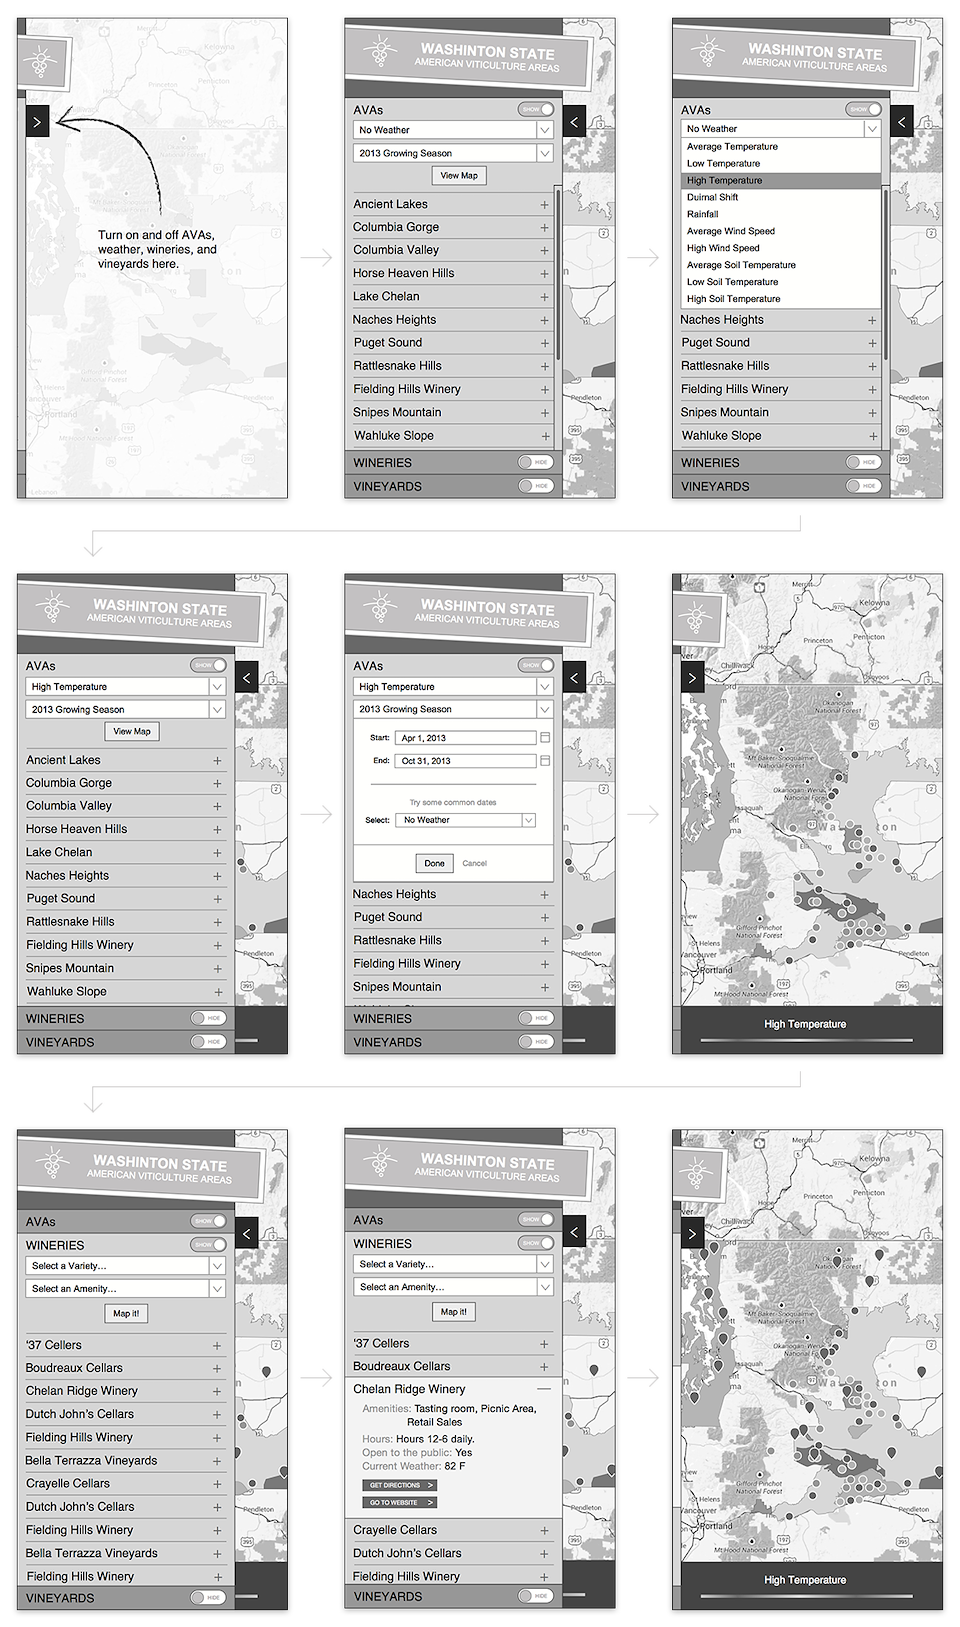
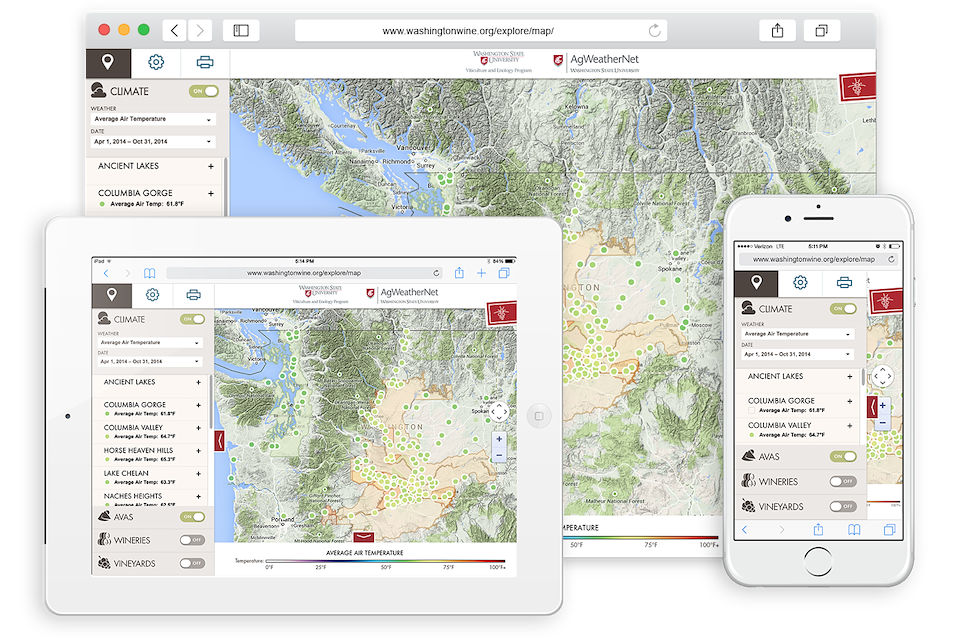
In order for the map to be useful for people visiting wineries and vineyards around the state, the tourist information needed be added to the map. Since we were also designing the map for a new audience that would be using the map on their phone while touring, we had to make the map mobile friendly. To let people customize the information they were looking for on the map, we added multiple switches to turn on climate, AVAs, wineries, and vineyards. We moved the weather and data drop down within the weather section, and then added a way to turn off the AVAs in case the information was not important to the current user. Finally, winery and vineyard pins were added to the map with their own on/off ui.
Let’s start from the beginning…
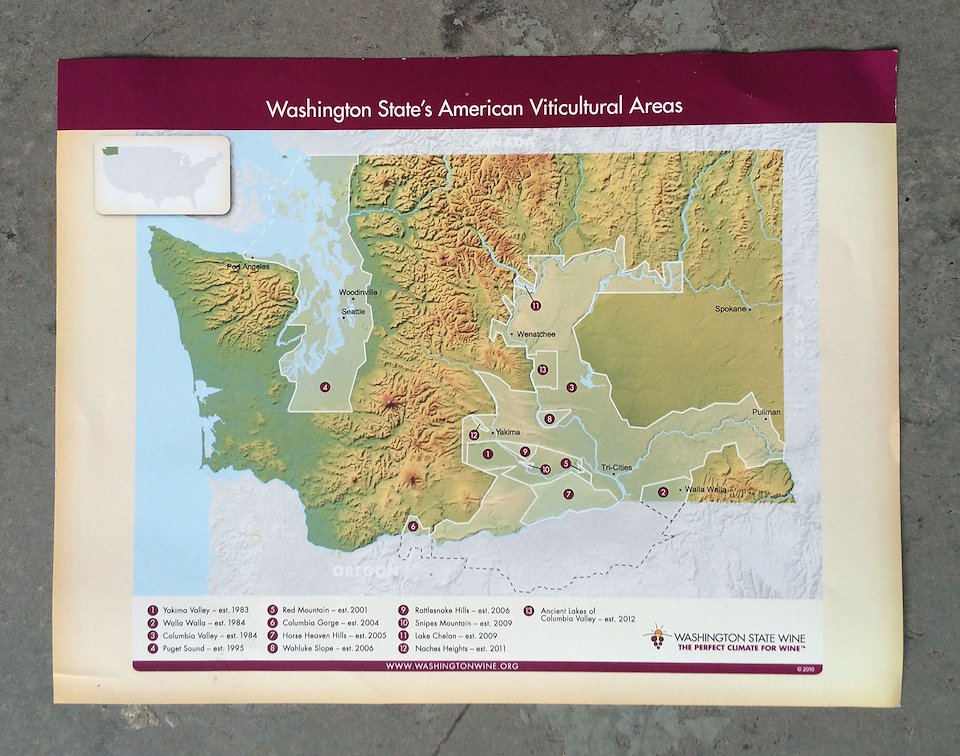
One printed map, that needed to become digital.
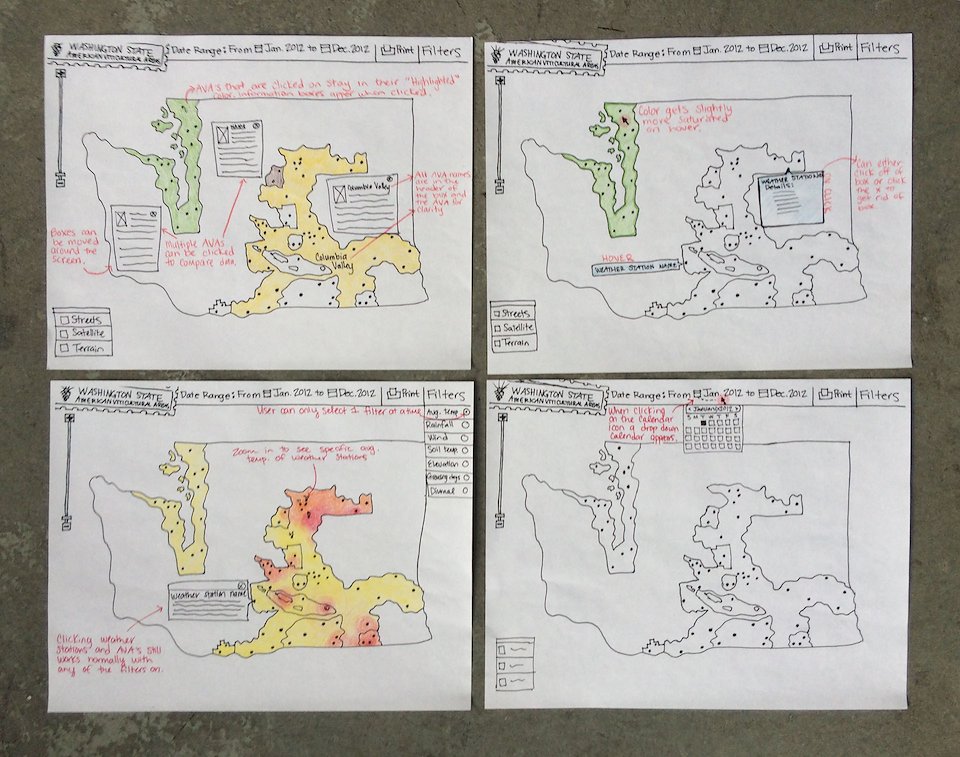
I started sketching potential interactions. We discussed pop ups for weather stations, heat maps for temperatures, and data selection options.
I created the first round of wires for desktop.
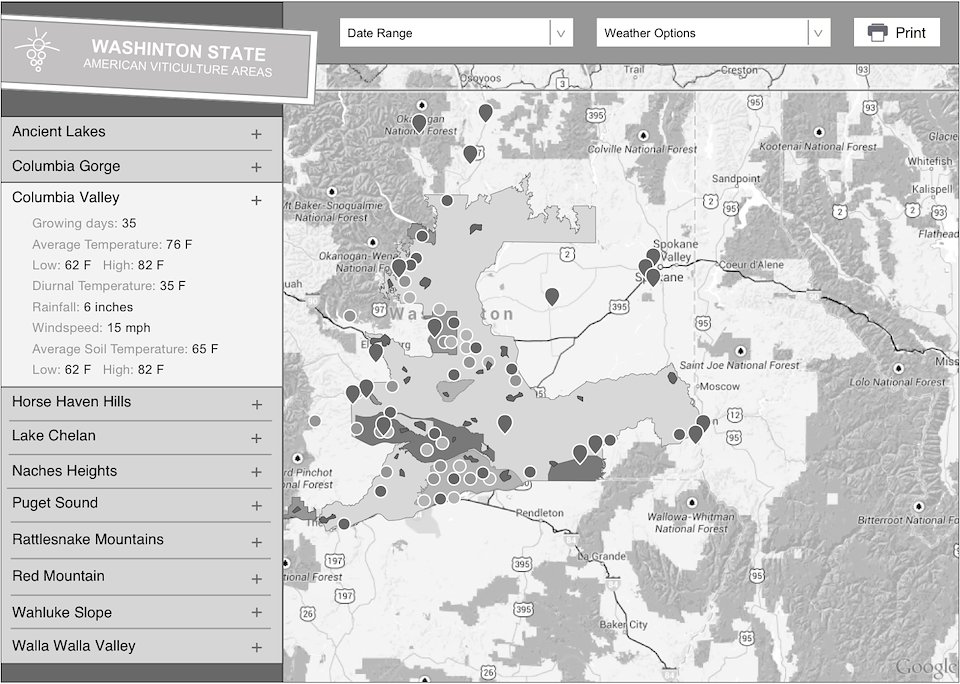
I did the visual design for the first version of the map. It was developed and released to the public.
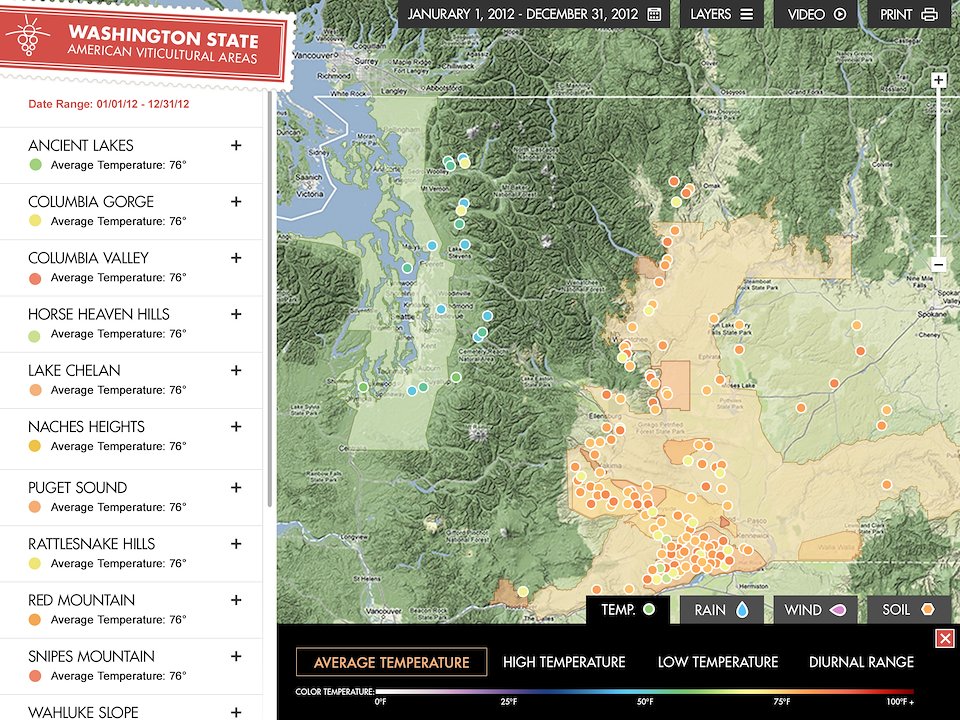
After the success of the desktop map, it was important to make it mobile. This use case wouldn’t be used much, since the map has so much information that is better viewed on a large screen, but we still wanted users to be able to look up information on their phones.
